Crossovers are not Chevy Tahoes or pickup trucks. Sure, go ahead and pretend a Model Y = a Suburban. You will be disappointed in 2 years when it isn't even close to 50%.Most available and selling EVs are now crossovers, not sedans.
45% of US light vehicle sales are crossovers.


Welcome to Tesla Motors Club
Discuss Tesla's Model S, Model 3, Model X, Model Y, Cybertruck, Roadster and More.
Register
Install the app
How to install the app on iOS
You can install our site as a web app on your iOS device by utilizing the Add to Home Screen feature in Safari. Please see this thread for more details on this.
Note: This feature may not be available in some browsers.
-
Want to remove ads? Register an account and login to see fewer ads, and become a Supporting Member to remove almost all ads.
You are using an out of date browser. It may not display this or other websites correctly.
You should upgrade or use an alternative browser.
You should upgrade or use an alternative browser.
Prediction, in Which Year Will New Electric Vehicle Sales Exceed 50% in the United States "Poll"
- Thread starter SDRick
- Start date
True but if/ when EV’s sell for less than an equivalent ICE, that will change. Just look at all the people waiting in line at Costco to gas up to save a few bucks compared to other gas stations around the corner with no line.So why are there so many Ford mustang ev's on lots? Folks are nuts if they think EV's, once the wealthy early adopters buy, are
going to be bought by low income folks, just nuts
ItsNotAboutTheMoney
Well-Known Member
Crossovers are not Chevy Tahoes or pickup trucks. Sure, go ahead and pretend a Model Y = a Suburban. You will be disappointed in 2 years when it isn't even close to 50%.
Who's pretending what? You seem to be pretending that most EVs are sedans when they clearly aren't. Just look at the top-selling EVs in the USA. Then look at the EV models in the pipeline and you'll see they're crossovers and pickups.
And why mention the Tahoes and Suburbans? Large SUVs are only about 3.5% of the market. It's a small segment dominated by a few GM models.
Also, why would I be disappointed about sales in 2025? I voted for 50% in 2034.

Fair enough. I agree with you then on the date. But I am not convinced that the EV "crossovers" available now are a match for the SUV segment in the graphs I referenced. And the pickup segment, which is a few Rivians and Lightenings so far, is well behind.Who's pretending what? You seem to be pretending that most EVs are sedans when they clearly aren't. Just look at the top-selling EVs in the USA. Then look at the EV models in the pipeline and you'll see they're crossovers and pickups.
And why mention the Tahoes and Suburbans? Large SUVs are only about 3.5% of the market. It's a small segment dominated by a few GM models.
Also, why would I be disappointed about sales in 2025? I voted for 50% in 2034.
Don't get me wrong, I will happily eat my words if we get to 50% sooner rather than later.
petit_bateau
Active Member
I've put the @David_Cary data for US BEV % sales in a spreadsheet (with thanks, and I am assuming he defintely means BEV%, not EV%), and I figured out the US BEV% for 2018 to make a longer series.I would remind everyone that this poll is about the US, and people don't purchase the same type of personal vehicle here as in much of the rest of the world.
The "S curve" should be viewing the US adoption rate with this in mind. Where are we in terms of EV SUV and pickup sales? I would guess way behind.
Most of the available and selling EVs are sedan types. Pickups are sitting on dealer lots unsold. If 100% of sales of passenger cars like sedans and hatchbacks were EVs, it would only be 33% of the total market for passenger vehicles in the US!
I've plotted that up against my dataset of the actual global BEV%, the actual global EV%, and the logistics curve that best fits the global EV%, see below.
I've also added in a series showing how well the US BEV% compares with the global BEV%. As you can see the US was adopting at about the same rate as the global adoption rate back in 2018-2019, but since then the USA has decoupled and slipped to about a 60% rate.
Assuming (heroically) that the fitted logistics S curve is a fair indication of the most likely global trajectory, and if one considers that for whatever reason the USA will continue to be a laggard at 60% or so, then the implication is the USA will reach 49% EV-penetration in motor vehicle sales in 2028.
Clearly there is some circularity in this as USA is a fair chunk of global motor vehicle sales (approx 20-21%) and so if USA is lagging then WOUSA must be correspondingly leading. But USA is only 20-21% and so this is a manageable circularity.
I have not tried to compute a US-specific S curve fit as the adoption data is too weak in small market sizes, and so too confused by noise in the data. It was only last year that I felt the global data was sound enough to develop an S curve, so it is premature to try to discern the curve signal in the noise for individual geographies or segments imho. These are best though of as offsets to the underlying global trend at this point in the cycle.
Following from that that it is not obvious what is the cause of the flip in the USA from being a pacing country to a lagging country. Was it a political issue, an economic issue, or a product availability issue, or something else, or a mix of all of these. Will it worsen, or improve. My own personal guess is some mixture of all of these. And to the extent that the US auto market is atypical in global terms (and to an extent it is) then this is both plausible in explanations of what is going on; and containable in analysis of this nature. My observation of US-ians is that when their wallets get heavily affected then they vote with their feet. Thus I expect that given that EV ownership (specifically BEV ownership) is becoming substantially cheaper than ICE ownership; then as compelling products become available in sufficient volume for each segment; then provided there are no overwhelming countercurrents I think US adoption of BEV will revert closer to the global mean. This would have the effect of pulling USA forwards to meet 50% in 2027 or even 2026. The overwhelming countercurrents is the biggest caveat in that as this is where US-politics might intervene, but that's not something I get a vote on.
(as an aside it seems to me that PHEV will peak at 5% soon, and then slide back to 3% by 2030, which is why I have not dwelt in any detail on them in this quickie analysis)
(I dread to think about how many grad school masters essays I am accidentally responsible for !)
Last edited:
In 2019 Tesla’s federal tax credit phased out ($3750 in 1H and $1875 in 2H) and Tesla vehicles were not eligible for tax credits for the next three years (2020-2022). Reduction and then elimination of the tax credit over a four-year period is likely a major factor slowing US EV adoption in that period since Tesla had such a huge portion of the US EV market.I've put the @David_Cary data for US BEV % sales in a spreadsheet (with thanks, and I am assuming he defintely means BEV%, not EV%), and I figured out the US BEV% for 2018 to make a longer series.
I've plotted that up against my dataset of the actual global BEV%, the actual global EV%, and the logistics curve that best fits the global EV%, see below.
I've also added in a series showing how well the US BEV% compares with the global BEV%. As you can see the US was adopting at about the same rate as the global adoption rate back in 2018-2019, but since then the USA has decoupled and slipped to about a 60% rate.
Assuming (heroically) that the fitted logistics S curve is a fair indication of the most likely global trajectory, and if one considers that for whatever reason the USA will continue to be a laggard at 60% or so, then the implication is the USA will reach 49% EV-penetration in motor vehicle sales in 2028.
Clearly there is some circularity in this as USA is a fair chunk of global motor vehicle sales (approx 20-21%) and so if USA is lagging then WOUSA must be correspondingly leading. But USA is only 20-21% and so this is a manageable circularity.
I have not tried to compute a US-specific S curve fit as the adoption data is too weak in small market sizes, and so too confused by noise in the data. It was only last year that I felt the global data was sound enough to develop an S curve, so it is premature to try to discern the curve signal in the noise for individual geographies or segments imho. These are best though of as offsets to the underlying global trend at this point in the cycle.
Following from that that it is not obvious what is the cause of the flip in the USA from being a pacing country to a lagging country. Was it a political issue, an economic issue, or a product availability issue, or something else, or a mix of all of these. Will it worsen, or improve. My own personal guess is some mixture of all of these. And to the extent that the US auto market is atypical in global terms (and to an extent it is) then this is both plausible in explanations of what is going on; and containable in analysis of this nature. My observation of US-ians is that when their wallets get heavily affected then they vote with their feet. Thus I expect that given that EV ownership (specifically BEV ownership) is becoming substantially cheaper than ICE ownership; then as compelling products become available in sufficient volume for each segment; then provided there are no overwhelming countercurrents I think US adoption of BEV will revert closer to the global mean. This would have the effect of pulling USA forwards to meet 50% in 2027 or even 2026. The overwhelming countercurrents is the biggest caveat in that as this is where US-politics might intervene, but that's not something I get a vote on.
(as an aside it seems to me that PHEV will peak at 5% soon, and then slide back to 3% by 2030, which is why I have not dwelt in any detail on them in this quickie analysis)
View attachment 956130
(I dread to think about how many grad school masters essays I am accidentally responsible for !)
Resumption of tax credits for Tesla vehicles this year should help accelerate growth but won’t entirely make up for lost time because network effects help sell EVs — for example you’re more likely to buy an EV if friends and family own one.
Last edited:
petit_bateau
Active Member
Yes, that is a very fair point.In 2019 Tesla’s federal tax credit phased out ($3750 in 1H and $1875 in 2H) and Tesla vehicles were not eligible for tax credits for the next three years (2020-2022). Reduction and then elimination of the tax credit over a four-year period is likely a major factor slowing US EV adoption in that period since Tesla had such a huge portion of the US EV market.
Resumption of tax credits for Tesla vehicles this year should help accelerate growth but won’t entirely make up for lost time because network effects help sell EVs — for example you’re more likely to buy an EV if friends and family own one.
I see Tesla now has a 60% market share in USA. Given that Tesla is working hard to skew deliveries back towards USA; and given that the competitors are now all-in on NACS adoption; then by 2024 we could see a lot of that slippage recovered. The next couple of years could be wild in USA.
(which would be good for Biden if he can pull off a goldilocks recovery in time to get the credit for it at the next election - reshoring + renewables + recovery)
ItsNotAboutTheMoney
Well-Known Member
Fair enough. I agree with you then on the date. But I am not convinced that the EV "crossovers" available now are a match for the SUV segment in the graphs I referenced. And the pickup segment, which is a few Rivians and Lightnings so far, is well behind.
Don't get me wrong, I will happily eat my words if we get to 50% sooner rather than later.
Over 70% of pick-ups are never used for towing.
75% of SUVs are never used for towing.
That makes the task of electrifying those segments a _lot_ easier that it could appear on the surface.
So, given that over half the market is moving people and stuff in the vehicle, it means that reaching 50% of the new vehicle market shouldn't be a utility problem..
The major obstacles to EV adoption are:
1) Cost
2) DCFC Charging infrastructure
3) Home and destination charging access. (30% of households in the new vehicle market do not have easy access to home charging).
I put in that order because reducing costs will help sales, which helps expand DCFC and that helps drive more sales and that in turn will push changes in the property market and access to home and destination charging.
Cost _was_ on track for maybe 2030 (certainly 50% earlier seems crazy for most of the USA), but has been hit hard by COVID, which set the supply side back even as demand grew, exacerbating any supply and demand imbalance in commodities.
LFP and LFMP are likely to help a lot with battery cost and that should begin to be more common in the USA by the mid 2020s.
NEVI should help a lot with DCFC because not only does it provide a lot of money, it also has requirements that help fix major issues with current infrastructure (outside the Tesla ecosystem). But NEVI will take a few years to have an impact. And now that the industry is going NACS, other manufacturers will get a boost from earlier access to V3+ Superchargers which should help accelerate growth.
Also, NACS, I hope, will help with access to charging at MDUs. Tesla can already do simple, plug-and-charge direct billing via its v3 Wall Connector and I think there's potential to expand that. The irony is that there's been much discussion about how a common standard is important for DCFC, when ultimately it could be more important for L2. Plug-and-charge can provide a cheap, flexible method of controlled access and billing by simplifying the EVSE.
(BTW, any shareholders reading, if you want to ask Tesla about their L2 billing efforts and whether they've had any discussions with manufacturers on access to that after NACS adoption, I'd be very interested to hear a response.)
Last edited:
The current count goes to 2030. I think this is because of what we're hearing. I've often said, the name of the game is to keep your name in the game. Manufactures need to keep talking EV so to continue loyalty. There are to many articles like below.

 www.motor1.com
to witness a half way mark anytime soon. If it is to be done, then Tesla will have to do it on their own.
www.motor1.com
to witness a half way mark anytime soon. If it is to be done, then Tesla will have to do it on their own.
GM Investing Nearly $1B To Build New V8 Engine And EV Components
GM invests $854 million to make the sixth generation of the small block V8. It is spending $64 million for castings and components to support future EVs.
www.motor1.com
petit_bateau
Active Member
So YTD in USA we have YoY growth of 47% in EVs with market shares of:The current count goes to 2030. I think this is because of what we're hearing. I've often said, the name of the game is to keep your name in the game. Manufactures need to keep talking EV so to continue loyalty. There are to many articles like below.
to witness a half way mark anytime soon. If it is to be done, then Tesla will have to do it on their own.GM Investing Nearly $1B To Build New V8 Engine And EV Components
GM invests $854 million to make the sixth generation of the small block V8. It is spending $64 million for castings and components to support future EVs.
- Tesla = 60%
- VAG (Audi+VW) = 4.8%, or 5.4% if you throw in Porsche as well
- GM (Chevrolet, Cadillac) = 6.4%
- Hyundai/Kia = 6.3%
- Ford = 4.6%
And in the middle of this GM put $854m into V8 tooling and only $64m into EV tooling ! Madness.
It is so obvious that VAG should merge with Ford to have a far better chance of joint survival. They need the right leader. Oh, ooops.
cwerdna
Well-Known Member
VAG should include Porsche. For GM, you should also add BrightDrop and GMC (yes, not huge numbers but they're still part of it).- VAG (Audi+VW) = 4.8%, or 5.4% if you throw in Porsche as well
- GM (Chevrolet, Cadillac) = 6.4%
On this note, Cami plant's surging electric-vehicle production hits snag: A battery shortage (where BrightDrop van are assembled) was posted over on chevybolt.org.
"“They’re out at all GM plants, they need batteries and it stems from a raw material bottleneck,” said Van Boekel. “Sales are through the roof. Things are good, but we just don’t have batteries.”"
h2ofun
Active Member
True but if/ when EV’s sell for less than an equivalent ICE, that will change. Just look at all the people waiting in line at Costco to gas up to save a few bucks compared to other gas stations around the corner with no line
Yep, if, when, IMO, never with batteries as they are today.True but if/ when EV’s sell for less than an equivalent ICE, that will change. Just look at all the people waiting in line at Costco to gas up to save a few bucks compared to other gas stations around the corner with no line.
cwerdna
Well-Known Member

EV sales growth's about to slow. If building is getting easier, why is selling them harder?
EV sales are brisk but aren't keeping up with supply and forcing an inventory buildup, Cox Automotive says. "Hard-growth days are ahead," it predicts.
www.usatoday.com
Electric Vehicle Sales in Q2 Strike Another Record, but Growth Ahead Will Be Hard Fought - Cox Automotive Inc.
Cox Automotive publishes a quarterly Kelley Blue Book new-vehicle sales report enumerating electric vehicle sales.
 www.coxautoinc.com
cwerdna
Well-Known Member
Ford pushes back EV target, warns of wider losses due to slower-than-expected adoption
Ford said it now expects its EV business unit, Ford Model e, to post an operating loss of about $4.5 billion this year
 www.cnbc.com
I wonder how much of this is the blame of dealerships over gouging customers. The biggest concern I see is how on Earth do you go from a negative 4.5 billion cash flow to a positive anytime soon?Ford pushes back EV target, warns of wider losses due to slower-than-expected adoption
Ford said it now expects its EV business unit, Ford Model e, to post an operating loss of about $4.5 billion this year
cwerdna
Well-Known Member
Ford pushes back EV target, warns of wider losses due to slower-than-expected adoption
Ford said it now expects its EV business unit, Ford Model e, to post an operating loss of about $4.5 billion this year
As Ford loses billions on EVs, the company embraces hybrids
Ford's hybrid hype runs counter to recent messaging from the Detroit automakers, which have touted the performance and popularity of all-electric favorites.
www.cnbc.com
From Ford Motor Company (F) Q2 2023 Earnings Call Transcript | The Motley Fool
John Murphy
-- Bank of America Merrill Lynch -- Analyst
Just one really quick follow-up there, Jim. When you're talking about hybrids, are you talking about plug-in hybrids or hybrids that will qualify for the $7,500 IRA credit just that they have batteries that are large enough? I just wanted to make sure we understand that.
Jim Farley -- President and Chief Executive Officer
Yes. I want to make it really clear. The term hybrid is going to -- in our industry going to get our company. Hybrid could be a serial hybrid.
It just means a motor powers batteries. It could be a hybrid in the traditional sense that like the F-150 hybrid or the -- and the hybrids I'm referring to are not plug-in hybrids. They are vehicles without a plug.
h2ofun
Active Member
Very interesting
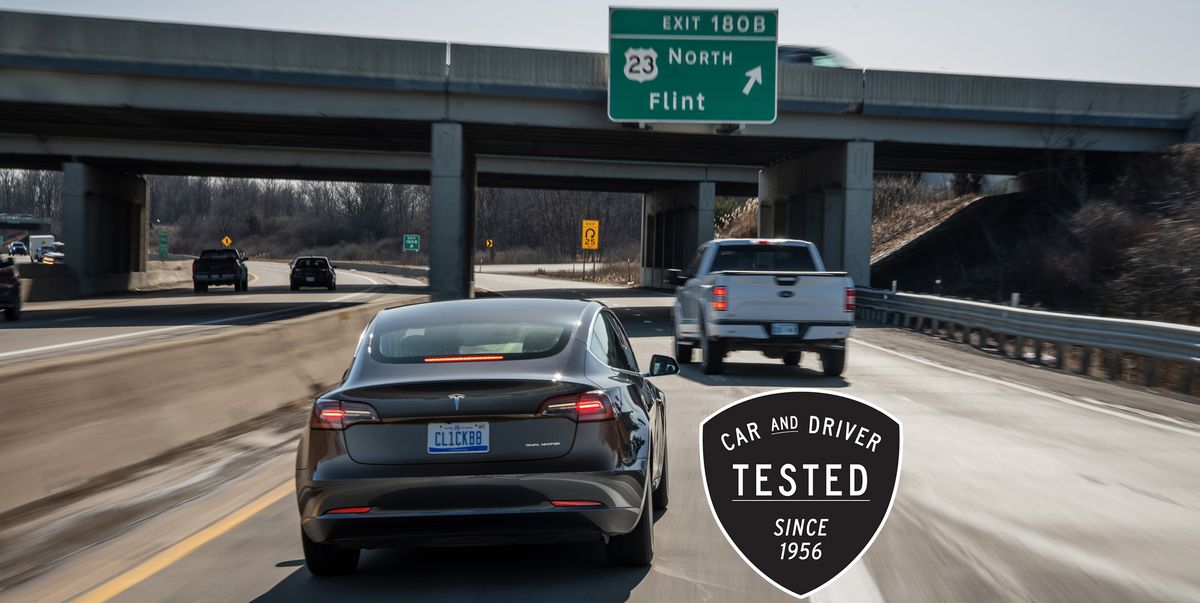
 www.caranddriver.com
Tested: How EPA EV Range Figures Compare with Reality
In our real-world highway testing, we're seeing big differences in the relative performance of EVs versus gas-powered vehicles. What gives?
www.caranddriver.com
cwerdna
Well-Known Member
Not really a prediction but I did listen to this on NPR not long ago: https://www.npr.org/2023/07/30/1190...fits-but-still-stumbling-when-it-comes-to-evs.
"RASCOE: So when we say auto companies are making a heck of a lot of money, how much money are we talking about? How much green?
DOMONOSKE: A lot. So Stellantis, which makes Chrysler, Dodge, Jeep and Ram, among others - they just set a record with the profits they just announced. GM is going to make more money this year than they thought, a cool billion dollars extra. So, yeah, people are buying a lot of new cars, even though prices are high and taking out a loan is getting more expensive."
and
"But they are pushing back their plans to really make a big push into EVs. Then you have Stellantis, which is slamming the accelerator. They are about to launch what they called an EV offensive in the United States, and in Europe, where electric vehicles are already a lot more popular, CEO Carlos Tavares said this."
Yeah, it would be quite an offensive for them as they (formerly FCA) hasn't had any consumer BEV shipping in the US ever since the compliance car gen 1 Fiat 500e was discontinued. But, as I mentioned earlier, Stellantis has sold many BEVs outside the US.
Weekly roundup: Stellantis posts record earnings, Tesla's 7-year financing, new AI solutions from J.D. Power says:
"Earlier this week: Stellantis reported record-breaking earnings of $12.1 billion, a 37% increase in net profit, and a 12% year-over-year revenue growth to $109 billion for the first half of 2023. "
David_Cary
Active Member
On the US being a laggard on EVS - it is also probably a geographic problem. We have a low density for much of the country and that leads to some component of range anxiety that is just different than China and Europe. I am not saying it is rational but the low density brings about this concern which may be causing us to lag behind. Obviously other places have rural areas but my impression is that these rural areas aren't visited as much.
When you look at some of the US national parks and realize how hard they are to get to from population centers, you can see the appeal of long range cars.
Things like a large car history - big parking spaces and wide roads - make electrification a bit harder.
On the plus side, we have more garages than most and newer housing stock compared to Europe so charging should be easier.
Lastly, we have really cheap gas from our history of inadequate taxation.
There are lots of reasons for rational and irrational US laggard. Tesla being in the US is probably what got us early growth but that has now equilibrated.
I question the figure that 30% of new car buyers don't have access to home charging. That certainly isn't the case where I live. While there are high end apartments and condos, the vast majority (90%?) of $100k households live in SFH or garaged townhomes. And the new condos/apartments have charging. I realize that other places vary but I can't think of other places in the US that I have lived that aren't like this. Certainly Manhattan dwellers don't buy that many new cars. And CA in general has home charging concers. But the rest of the country - I would think new cars would have a spot to go live in. Not all cars - just new cars. If I lived with street parking or even no garage - I would buy a used car. I do live in neighborhood with $100k cars parked on the street but I find that completely irrational - a few doors down is a relatvely new 911 looking thing that is probably quite a bit over $100k - on the street every night and every hail storm and parked under 50+ year old trees.
Last edited:
cwerdna
Well-Known Member
I was at a relatively new Silicon Valley apartment complex recently w/multi-story parking semi-recently. I'd guesstimate that between 5 to 9% of parking spaces there had EV charging at all (all ChargePoint CT4000 for J1772 level 2). I did see some Teslas in there and at least two Taycans.
Looks like apartments there range from $3100 to $6600/month. If I drop their price selector to the lowest possible, I see a ~640 sq ft studio for $3175/mo. I see a 2 bedroom, 2 bath with 1434 sq ft and it's reduced price of $5225/mo. That seems to be about the most expensive currently available there. It is in the heart of Silicon Valley and near a lot of major tech companies, some within walking distance.
Do not buy an electric car if you live in California was a reminder of something I totally forgot about. Apparently, there's a bill in being proposed that would tack on income-based fixed rate charges onto electric bills in CA.
See High-stakes battle brewing over California power bills and California power companies propose income-based rates: how it would work. If this goes thru, this could be yet another barrier for CA achieving it's mandate of at least 80% of new light automobiles sold there being ZEVs.
Another thing to look at is New Car Sales by State - Full Year 2022 Vehicle Sales Report, if accurate (click to sort by rank) vs. Alternative Fuels Data Center: Maps and Data - Electric Vehicle Registrations by State. Of course, CA is going to have the bulk of EV sales in sheer number, just as it already is by existing registrations. But go through the 25 or so states. Some aren't real strong in terms of existing EV registrations vs. their new vehicle sales like PA, MI, OH, OK, IN, LA and SC.
Last edited:
Similar threads
- Replies
- 19
- Views
- 1K
- Replies
- 2
- Views
- 700
- Replies
- 5
- Views
- 1K