Welcome to Tesla Motors Club
Discuss Tesla's Model S, Model 3, Model X, Model Y, Cybertruck, Roadster and More.
Register

TSLA Technical Analysis

This site may earn commission on affiliate links.
Craig Johnson of Piper Sandler - this morning:
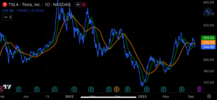
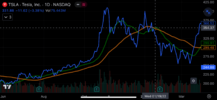
• TSLA—Shares have reversed a declining price channel/surpassed resistance near $218• Recent bullish crossover between the 10-/30-week WMAs.• RS has climbed into positive territory and notable TechniGrade ranking.• Add to positions on pullbacks toward the rising 10-week MA.
 
Craig Johnson - Piper Sandler - this morning:
• TSLA—Shares have confirmed support off a prior breakout level.• Back above the 10-/30-week WMAs.• RS has inflected higher off the midline and impressive TechniGrade ranking.• Add to positions, a retest of the July highs near $299 appears likely
 
  • Like
Reactions: bkp_duke
Tesla's 50-day SMA has dropped below its 20-day SMA.

Generally this is not a good sign technically.
here is a graph, back to 24/4/2023
looks like happened a few times

1695414015648.png
 
Jan 19 Quad Witching expiry now at 2,883,581 options contracts. There is massive money at stake. Jan 19 Max Pain now at $210 and dropping; expect the SP to stay well below the 200 day MA. Jan 26 Max Pain is $240, so a swift recovery back above the 200 day MA around the earnings call is probable.

TA: On the daily, weekly, and monthly timeframes the 200, 50, and 100 DMA are incredibly tight within about 10% of eachother. This type of correlation across all time-frames is extremely unusual for TSLA. This puts the mean implied volatility under 0.5 for all timeframes (10,20,30,60,90,120,150D). The last time we saw this was Oct 2021, and prior to that Oct 2019. Both preceeded massive runs. Jus' sayin'...
 
possibly going into this, accumulation/distribution line is _usually_ fairly flat & stable but has gotten wild the last 4 weeks, bouncing up & down
(based on volume & prices & ups & downs)
I have _no_ idea what it means except something has changed

1705114533272.png

1705114591252.png
 

Attachments

  • 1705114299036.png
    1705114299036.png
    80.1 KB · Views: 17
Last edited by a moderator:
  • Like
Reactions: hydro
Craig Johnson of Piper Sandler - today:
• TSLA—Shares are approaching the neckline of an inverted head and shoulders formation.• Back above the 10-/30-week WMAs.• RS has rebounded back into positive territory.• Add to positions on a breakout above the neckline.
I have a question I need clarity: When the SP recovers say back to 240 (MaxPain) the final week of Jan, and begins to approach the neckline again would the pattern now still valid if the right inverted shoulder (minimum) is now lower than the left inverted shoulder? Or does the right need to be a higher value than the left for it to be an inverted HS? Thank you anyone who can help
 
Whenever the 50DMA (green) settles between the 100 and 200, it is indication the spring has coiled, and we get a large move. It's coming! View attachment 1010944
for those of us whom are red/green color blind, I see a _blue_ line and 2 red/green identical color lines
could you make one of those 2 a different color please
 
  • Like
Reactions: The Accountant
for those of us whom are red/green color blind, I see a _blue_ line and 2 red/green identical color lines
could you make one of those 2 a different color please
Humblest apologies! Thank you for the awareness. I'll keep this in mind in the future. The 50DMA (blue) still sits in between the 100DMA (purple) and the 200DMA(orange). The moving averages continue to converge on all timeframes (daily, weekly, monthly). Daily timeframe shown below. The RSI is now incredibly oversold on the daily and weekly (not shown). If I was a betting man (and I am) the move that's coming quite soon would be...UP.
Screenshot_20240129_232336_Chrome.jpg