I’ve been reading several books about Elliott Wave Theory lately. Many Elliott Wave theorists claim that logarithmic charting is better for longer-term trends while arithmetic is better for shorter-term trends, although they say you should test both. This is because arithmetic charting only accounts for absolute value of SP moves whereas log charting accounts for the percentage change which smooths out the long-term chart.
Looking at tsla on a logarithmic chart shows you a different picture than arithmetic. On a log chart, there is no trendline support at 139-140 area. Any way you draw the ascending trendline leading back to the 2019 or 2020 bottom, it has been broken. But on an arithmetic chart, you can see a support trendline leading back to the 2020 bottom, hitting the Jan 6th 2023 bottom, and supporting SP on Apr 22nd at 139.
Elliott Wave Theory also states that wave 3 of an impulse move can’t be the shortest wave, and since the perceived wave 3 in this falling wedge pattern was from 205.60 to 160.51 (45.09 points) wave 5, which began at 184.25, shouldn’t trade below 139.16. SP did fall slightly below this level but only by 0.36 points. I give full credit to
@dl003 for pointing this out. I’m curious to know what you think about log v arithmetic charting when it comes to tsla.
In my opinion, daily and hourly price action on Apr 22nd, the presumed bottom, were not in and of itself significant. However, what happened the rest of the week was.
To identify a trend reversal, I like to use a combination of hourly, daily, and weekly charts. In this case, the only candle that shows us anything meaningful is the weekly. And the high volume candle for this past week suggests that the trend likely has reversed. Furthermore, the bullish divergence on the daily chart leading back to Jan 25th helps prove the bears have lost momentum.
This is shockingly similar to the top on July 19th, 2023. Price action on July 19th was not in and of itself significant. But look at the weekly chart and you’ll see an engulfing reversal candle with high volume. This was more convincing, especially after hitting the long-term downtrend leading back to the all-time high made on Nov 4th, 2021. This is why it is important to use a combination of hourly, daily, and weekly charts.
I would also like to mention that when we get a huge gap, like on Apr 24th, it is a strong sign that the trend is in the direction of the gap. Closing this gap is going to be very hard. If you are long and SP does close the gap made on Apr 24th, I would no longer be bullish.
So, if the bottom is in and a new rally has begun, the next question becomes when is the best spot to go long?
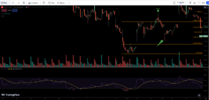
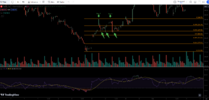
From my research, SP always retests at least 0.382 of the first major leg up. I also notice this typically begins on day 3 after the gap. See several examples below.
Jan 6th, 2023
View attachment 1042686
July 19th, 2023 (post q2 earnings)
View attachment 1042687
Oct 31st, 2023
View attachment 1042689
If Friday ended the first leg up we should expect to see SP test at least 159.50 (0.382). On Friday, we can see a 1hr bearish divergence, so a retracement seems logical. However, this divergence may extend into the start of this week (175-177) before any major retracement.
View attachment 1042695
If this is the start of a new rally, I don't see us hitting 155. My gut feeling is that 159.50 will likely get bought up quickly. The gap from last week is too strong and there will be too many people waiting to cover shorts and go long at the first sign of a pullback.


 . Seems like a rather reasonable reaction to me.