Yes, market in action. Price was too high, so people worked hard finding alternatives, reducing demand increase while production was also increasing. This is why “investing” in single commodities is fraught with pitfalls. It’s why my basket of battery mineral stocks is composed of diversified mining majors with but a single moonshot lithium miner in the mix (and that stock is 1/10 the allocation of the basket of majors).


Welcome to Tesla Motors Club
Discuss Tesla's Model S, Model 3, Model X, Model Y, Cybertruck, Roadster and More.
Register
Install the app
How to install the app on iOS
You can install our site as a web app on your iOS device by utilizing the Add to Home Screen feature in Safari. Please see this thread for more details on this.
Note: This feature may not be available in some browsers.
-
Want to remove ads? Register an account and login to see fewer ads, and become a Supporting Member to remove almost all ads.
You are using an out of date browser. It may not display this or other websites correctly.
You should upgrade or use an alternative browser.
You should upgrade or use an alternative browser.
Possible Magnis/Tesla news
 www.afr.com
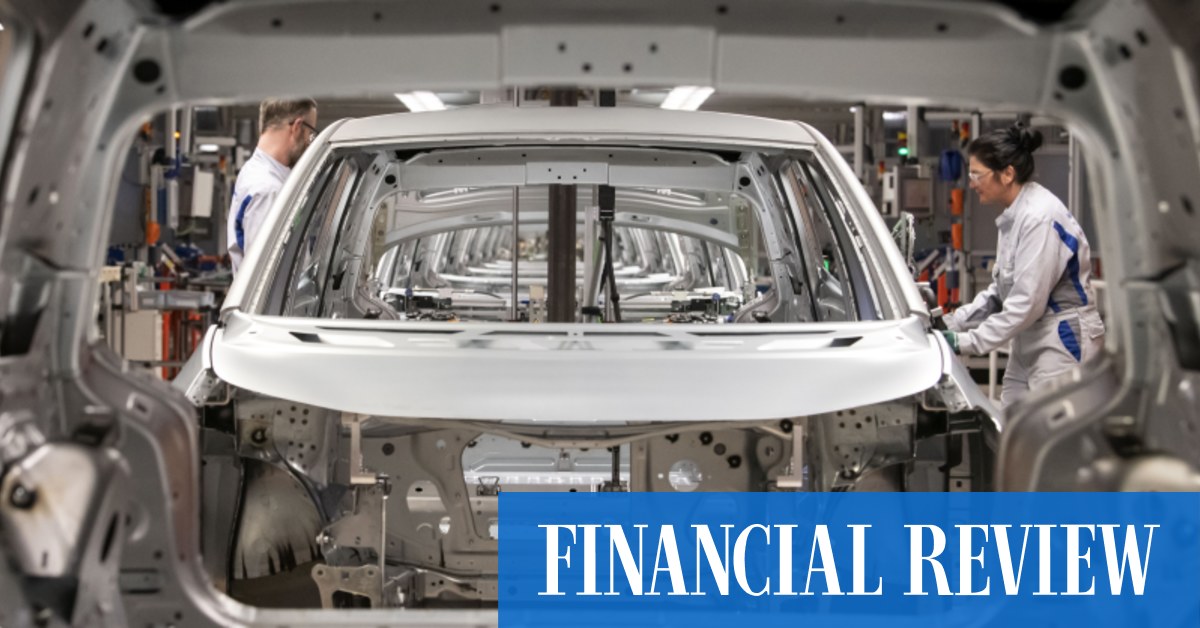
Magnis Energy to join Tesla crew with binding offtake deal
Electric vehicles giant Tesla has swooped on promised output from another Australian battery materials play, this time taking its big appetite to Magnis Energy Technologies.
petit_bateau
Active Member
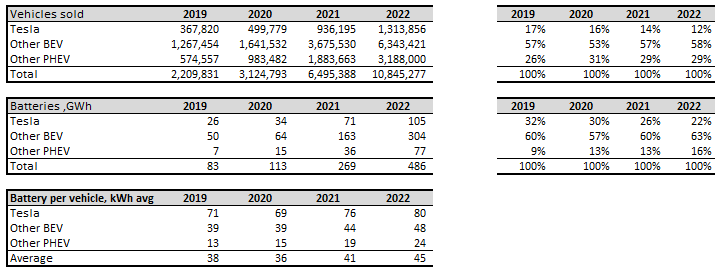
I didn't really get any solid response to my post yesterday in the main investor thread which posed two questions, so I figured I'd try here instead in the resource thread (is there a cell thread ?). You folks are likely counting the tonnage from the mine deals and translating it into GWh of cells, and so you ought to be more cognisant of this issue than the general TSLA investor.
 teslamotorsclub.com
The two questions were,
- Q1. Can the cell suppliers (and their mineral suppliers) continue to meet the total annual increases that the historical evidence suggests will continue to be met ?
- Q2. Can Tesla continue to capture at least a 20% market share of that cell supply for vehicle use ?
I had expected critique of my S-curve matching technique on various grounds, so have run the analysis myself different ways so as to see if that casts any light on Q1. It turns out it makes very little difference, and it didn't seem sensible to include that level of detail in the main thread, but I'll throw it on the table here so you can see that the analysis is robust, given the underlying assumption that the cell supply chain will meet the annual demand increments. (hence my Q1, to check if this is realistically the case).
The analysis I presented yesterday showed a history match on the % of the total annual motor industry production that is met by EVs. A valid critique of that would be that the motor vehicle production numbers in recent years have dipped, therefore this flatters the EV% uptake, and so will naturally lead to a prediction of a more rapid uptake rate than is realistic. Therefore I have also run the same analysis using the actual EV numbers (EV#) as the historical 'seed' which strips out this effect. The next level of criticism is to say that perhaps the EV uptake has been fundamentally constrained by battery growth, which in turn displays itself also via the cells/vehicle parameter, and so I have again run the analysis using cell production (in GWh) as the seed. It turns out that all three approaches give very similar curve trajectories with barely 6-months between the respective midpoint penetrations.

Therefore the analysis so far seems pretty robust in respect of the historical adoption data that is used as the seed in the optimisation of the three paramaters that are matched in the process of generating the respective S curves.
But is it realistic to expect the cell industry to meet the requisite annual capacity adds ? Here are those three curves again, but this time in cell terms for just vehicle usage:

As we all know the cell supply needs to 20x from where we are now, for vehicles alone. My hypothess is that it will achieve this as vehicles are - in general - able to pay a mobility premium for cells. Therefore vehicles will tend to outbid stationary storage if cell supply becomes a limiting factor, and since stationary storage is also growing strongly the evidence suggests cell supply has not been an industry-wide constraint so far.
But it might become a constraint in the crunch years to come, so here is the graph of (vehicle-specific) annual capacity additions this implies:

As you can see in all three forecasts the peak is at about an annual addition of 1,000 - 1,100 GWh and that peak lasts for three years, with a further two years either side above 800 GWh adds per year. That is a pretty good (i.e. stable and long-lasting) peak for a supply chain to scale itself to meet.
In annual % growth terms the worst is sort-of happening now, which one might regard as a training regime for the subsequent phase.

So, I say again to you folks who are looking at the resource question, can you (Q1) see any show-stoppers in the growth of vehicle cell-supply at an industry level ? and (Q2) to what extent is Tesla positioned to regain ground (that it has been losing) in respect of vehicle cells ?
===
I'm minded to next look more deeply into the possible growth trajectory for stationary storage, but it makes a lot of sense to flush out any cell growth constraints now before it gets any more complex.
Tesla, TSLA & the Investment World: the Perpetual Investors' Roundtable
Running into fire and police vehicles that have their flashers engaged is not all that uncommon. Been so for years. 100% sure it's not AP or FSD. People get fixated on the flashing lights and if they are not fully aware often run into them. Tesla issued a patch to AP the last time this came up...
teslamotorsclub.com
The two questions were,
- Q1. Can the cell suppliers (and their mineral suppliers) continue to meet the total annual increases that the historical evidence suggests will continue to be met ?
- Q2. Can Tesla continue to capture at least a 20% market share of that cell supply for vehicle use ?
I had expected critique of my S-curve matching technique on various grounds, so have run the analysis myself different ways so as to see if that casts any light on Q1. It turns out it makes very little difference, and it didn't seem sensible to include that level of detail in the main thread, but I'll throw it on the table here so you can see that the analysis is robust, given the underlying assumption that the cell supply chain will meet the annual demand increments. (hence my Q1, to check if this is realistically the case).
The analysis I presented yesterday showed a history match on the % of the total annual motor industry production that is met by EVs. A valid critique of that would be that the motor vehicle production numbers in recent years have dipped, therefore this flatters the EV% uptake, and so will naturally lead to a prediction of a more rapid uptake rate than is realistic. Therefore I have also run the same analysis using the actual EV numbers (EV#) as the historical 'seed' which strips out this effect. The next level of criticism is to say that perhaps the EV uptake has been fundamentally constrained by battery growth, which in turn displays itself also via the cells/vehicle parameter, and so I have again run the analysis using cell production (in GWh) as the seed. It turns out that all three approaches give very similar curve trajectories with barely 6-months between the respective midpoint penetrations.
Therefore the analysis so far seems pretty robust in respect of the historical adoption data that is used as the seed in the optimisation of the three paramaters that are matched in the process of generating the respective S curves.
But is it realistic to expect the cell industry to meet the requisite annual capacity adds ? Here are those three curves again, but this time in cell terms for just vehicle usage:
As we all know the cell supply needs to 20x from where we are now, for vehicles alone. My hypothess is that it will achieve this as vehicles are - in general - able to pay a mobility premium for cells. Therefore vehicles will tend to outbid stationary storage if cell supply becomes a limiting factor, and since stationary storage is also growing strongly the evidence suggests cell supply has not been an industry-wide constraint so far.
But it might become a constraint in the crunch years to come, so here is the graph of (vehicle-specific) annual capacity additions this implies:
As you can see in all three forecasts the peak is at about an annual addition of 1,000 - 1,100 GWh and that peak lasts for three years, with a further two years either side above 800 GWh adds per year. That is a pretty good (i.e. stable and long-lasting) peak for a supply chain to scale itself to meet.
In annual % growth terms the worst is sort-of happening now, which one might regard as a training regime for the subsequent phase.
So, I say again to you folks who are looking at the resource question, can you (Q1) see any show-stoppers in the growth of vehicle cell-supply at an industry level ? and (Q2) to what extent is Tesla positioned to regain ground (that it has been losing) in respect of vehicle cells ?
===
I'm minded to next look more deeply into the possible growth trajectory for stationary storage, but it makes a lot of sense to flush out any cell growth constraints now before it gets any more complex.
Last edited:
Buckminster
Well-Known Member
My gut feeling is that non China supply will struggle. Tesla will manufacture enough of their own cells to get close to the 20m figure. Most of which will be ~30kWh RTs.I didn't really get any solid response to my post yesterday in the main investor thread which posed two questions, so I figured I'd try here instead in the resource thread (is there a cell thread ?). You folks are likely counting the tonnage from the mine deals and translating it into GWh of cells, and so you ought to be more cognisant of this issue than the general TSLA investor.
Tesla, TSLA & the Investment World: the Perpetual Investors' Roundtable
Running into fire and police vehicles that have their flashers engaged is not all that uncommon. Been so for years. 100% sure it's not AP or FSD. People get fixated on the flashing lights and if they are not fully aware often run into them. Tesla issued a patch to AP the last time this came up...
The two questions were,
- Q1. Can the cell suppliers (and their mineral suppliers) continue to meet the total annual increases that the historical evidence suggests will continue to be met ?
- Q2. Can Tesla continue to capture at least a 20% market share of that cell supply for vehicle use ?
I had expected critique of my S-curve matching technique on various grounds, so have run the analysis myself different ways so as to see if that casts any light on Q1. It turns out it makes very little difference, and it didn't seem sensible to include that level of detail in the main thread, but I'll throw it on the table here so you can see that the analysis is robust, given the underlying assumption that the cell supply chain will meet the annual demand increments. (hence my Q1, to check if this is realistically the case).
The analysis I presented yesterday showed a history match on the % of the total annual motor industry production that is met by EVs. A valid critique of that would be that the motor vehicle production numbers in recent years have dipped, therefore this flatters the EV% uptake, and so will naturally lead to a prediction of a more rapid uptake rate than is realistic. Therefore I have also run the same analysis using the actual EV numbers (EV#) as the historical 'seed' which strips out this effect. The next level of criticism is to say that perhaps the EV uptake has been fundamentally constrained by battery growth, which in turn displays itself also via the cells/vehicle parameter, and so I have again run the analysis using cell production (in GWh) as the seed. It turns out that all three approaches give very similar curve trajectories with barely 6-months between the respective midpoint penetrations.
View attachment 909340
Therefore the analysis so far seems pretty robust in respect of the historical adoption data that is used as the seed in the optimisation of the three paramaters that are matched in the process of generating the respective S curves.
But is it realistic to expect the cell industry to meet the requisite annual capacity adds ? Here are those three curves again, but this time in cell terms for just vehicle usage:
View attachment 909342
As we all know the cell supply needs to 20x from where we are now, for vehicles alone. My hypothess is that it will achieve this as vehicles are - in general - able to pay a mobility premium for cells. Therefore vehicles will tend to outbid stationary storage if cell supply becomes a limiting factor, and since stationary storage is also growing strongly the evidence suggests cell supply has not been an industry-wide constraint so far.
But it might become a constraint in the crunch years to come, so here is the graph of (vehicle-specific) annual capacity additions this implies:
View attachment 909344
As you can see in all three forecasts the peak is at about an annual addition of 1,000 - 1,100 GWh and that peak lasts for three years, with a further two years either side above 800 GWh adds per year. That is a pretty good (i.e. stable and long-lasting) peak for a supply chain to scale itself to meet.
In annual % growth terms the worst is sort-of happening now, which one might regard as a training regime for the subsequent phase.
View attachment 909345
So, I say again to you folks who are looking at the resource question, can you (Q1) see any show-stoppers in the growth of vehicle cell-supply at an industry level ? and (Q2) to what extent is Tesla positioned to regain ground (that it has been losing) in respect of vehicle cells ?
===
I'm minded to next look more deeply into the possible growth trajectory for stationary storage, but it makes a lot of sense to flush out any cell growth constraints now before it gets any more complex.
petit_bateau
Active Member
Well this is a marker that is being put down, courtesy @SageBrushMy gut feeling is that non China supply will struggle. Tesla will manufacture enough of their own cells to get close to the 20m figure. Most of which will be ~30kWh RTs.

The world's largest EV battery maker will cut costs for Chinese automakers – but not for Tesla
China's CATL, the world's largest EV battery maker, is reportedly offering significantly lower battery costs to some Chinese EV makers.
 electrek.co
Your questions might be more related to a continuation of the past mining and whether the mining industry can be scaled up going forward. But outside of that, global politics is always a concern and China is by far the #1 provider and refiner of cobalt. And then ESG risk if the public ever becomes aware and gets traction regarding child slavery, unhealthy working conditions, etc at Congo cobalt mines..I didn't really get any solid response to my post yesterday in the main investor thread which posed two questions, so I figured I'd try here instead in the resource thread (is there a cell thread ?). You folks are likely counting the tonnage from the mine deals and translating it into GWh of cells, and so you ought to be more cognisant of this issue than the general TSLA investor.
Tesla, TSLA & the Investment World: the Perpetual Investors' Roundtable
Running into fire and police vehicles that have their flashers engaged is not all that uncommon. Been so for years. 100% sure it's not AP or FSD. People get fixated on the flashing lights and if they are not fully aware often run into them. Tesla issued a patch to AP the last time this came up...
The two questions were,
- Q1. Can the cell suppliers (and their mineral suppliers) continue to meet the total annual increases that the historical evidence suggests will continue to be met ?
- Q2. Can Tesla continue to capture at least a 20% market share of that cell supply for vehicle use ?
I had expected critique of my S-curve matching technique on various grounds, so have run the analysis myself different ways so as to see if that casts any light on Q1. It turns out it makes very little difference, and it didn't seem sensible to include that level of detail in the main thread, but I'll throw it on the table here so you can see that the analysis is robust, given the underlying assumption that the cell supply chain will meet the annual demand increments. (hence my Q1, to check if this is realistically the case).
The analysis I presented yesterday showed a history match on the % of the total annual motor industry production that is met by EVs. A valid critique of that would be that the motor vehicle production numbers in recent years have dipped, therefore this flatters the EV% uptake, and so will naturally lead to a prediction of a more rapid uptake rate than is realistic. Therefore I have also run the same analysis using the actual EV numbers (EV#) as the historical 'seed' which strips out this effect. The next level of criticism is to say that perhaps the EV uptake has been fundamentally constrained by battery growth, which in turn displays itself also via the cells/vehicle parameter, and so I have again run the analysis using cell production (in GWh) as the seed. It turns out that all three approaches give very similar curve trajectories with barely 6-months between the respective midpoint penetrations.
View attachment 909340
Therefore the analysis so far seems pretty robust in respect of the historical adoption data that is used as the seed in the optimisation of the three paramaters that are matched in the process of generating the respective S curves.
But is it realistic to expect the cell industry to meet the requisite annual capacity adds ? Here are those three curves again, but this time in cell terms for just vehicle usage:
View attachment 909342
As we all know the cell supply needs to 20x from where we are now, for vehicles alone. My hypothess is that it will achieve this as vehicles are - in general - able to pay a mobility premium for cells. Therefore vehicles will tend to outbid stationary storage if cell supply becomes a limiting factor, and since stationary storage is also growing strongly the evidence suggests cell supply has not been an industry-wide constraint so far.
But it might become a constraint in the crunch years to come, so here is the graph of (vehicle-specific) annual capacity additions this implies:
View attachment 909344
As you can see in all three forecasts the peak is at about an annual addition of 1,000 - 1,100 GWh and that peak lasts for three years, with a further two years either side above 800 GWh adds per year. That is a pretty good (i.e. stable and long-lasting) peak for a supply chain to scale itself to meet.
In annual % growth terms the worst is sort-of happening now, which one might regard as a training regime for the subsequent phase.
View attachment 909345
So, I say again to you folks who are looking at the resource question, can you (Q1) see any show-stoppers in the growth of vehicle cell-supply at an industry level ? and (Q2) to what extent is Tesla positioned to regain ground (that it has been losing) in respect of vehicle cells ?
===
I'm minded to next look more deeply into the possible growth trajectory for stationary storage, but it makes a lot of sense to flush out any cell growth constraints now before it gets any more complex.
MC3OZ
Active Member
I am waiting for March 1 to find out progress on 4680 production, and perhaps if Tesla can use, or intends to use some of their patents.So, I say again to you folks who are looking at the resource question, can you (Q1) see any show-stoppers in the growth of vehicle cell-supply at an industry level ? and (Q2) to what extent is Tesla positioned to regain ground (that it has been losing) in respect of vehicle cells ?
I interpret the focus on raw materials and meaning Tesla has a plan for the 4680 production ramp.
For example, it is likely that cathode material for Berlin 4680 production comes from the Austin cathode plant.
IMO the cathode plant, the building next to it, and the Lithium refinery that is being built in Texas are probably vital parts of the 4680 ramp.
I also believe Elon when he says they have a good path for increasing 4680 energy density and lowering costs. That statement reminds me of a patent I studied in the Engineering thread. I'm waiting for Limiting Factor to do a professional analysis of that patent.
I also think wat is revealed on March 1 will include energy storage batteries.
So to answer the question directly, the extent to which Tesla can regain ground is dependent partially on what they reveal on March 1, and very dependent of 4680 progress. So I am waiting until after March 1 to draw any conclusions.
Golden handcuffs. Buyers have to commit to buying 80% of cells from CATL. Only smaller manufacturers can accept those terms.Well this is a marker that is being put down, courtesy @SageBrush
View attachment 909427
The world's largest EV battery maker will cut costs for Chinese automakers – but not for Tesla
China's CATL, the world's largest EV battery maker, is reportedly offering significantly lower battery costs to some Chinese EV makers.
Buckminster
Well-Known Member
The Magnis deal looks real.
Minimum 17,500 tons/yr starting Feb 2025, maximum 35,000 tons/yr for minimum 3 yrs at fixed price.
petit_bateau
Active Member
I agree with the mining being the real constraint. People don't just rush out and build mines unless they have a way to manage the risk of it being stranded capital. Hence - as we can see - Tesla signing all sorts of offtake agreements/etc with mining firms. That to an extent answers my Q2 (with more to be revealed by Tesla next week I hope). However does anyone who have a decent insight into the situation for the wider auto industry, i.e. Q1.Your questions might be more related to a continuation of the past mining and whether the mining industry can be scaled up going forward. But outside of that, global politics is always a concern and China is by far the #1 provider and refiner of cobalt. And then ESG risk if the public ever becomes aware and gets traction regarding child slavery, unhealthy working conditions, etc at Congo cobalt mines..
The dominant cell chemistry is fast becoming LFP, and LFP doesn't use cobalt. Or nickel. Or manganese. The market seems to be shifting quite firmly away from NCA/NMC towards LFP for all stationary storage, and the majority of ordinary vehicle use. Maybe note high-performance vehicles, but certainly most. (I know Tesla are still using NMC in Powerwall but they've shifted to LFP in Megapack, and surely it can't be long before they make the same switch in Powerwall).
There is a LMFP (i.e. with manganese) but I'm not sure what adoption it is getting, given that LFP is good enough for almost everything. This press release is interesting, so too are the comments below it.
VSPC boosts energy density of LFP cells up to 25% by incorporating manganese; LMFP
Lithium Australia subsidiary VSPC reports significant progress towards improving the energy density of LFP (lithium ferro phosphate) Li-ion battery cells by adjusting its proprietary manufacturing processes to incorporate manganese into the cathode active material during production. The addition...
www.greencarcongress.com
nativewolf
Active Member
My take from my USA focused battery plant spreadsheet is that LFP is going to be the major chemistry going forward from 2027-8. Fords new LFP plant to be built in Michigan will be producing in 2026 and GM plans for LFP too etc etc . Several others as well. China has such a giant head start in LFP it is hard to do meaningful analysis without understanding their building plans.
I don’t think mining has so far to go because of this transition to LFP. Nickl being the constraint but that is minor after 2027. Based on improved LFP I think we see 300 mile range mid sized car LFP being dominant by 2027.
So as to your first question no problem just some price premium for power/ range.
As to #2. No, they will not unless they pull a rabbit from the hat this year on 4680. I dont see battery capacity to reach 2025 goals without being very dependent on other vendors. A risk with China , see the CATL announcement. The decision to prop up Chinese ev makers is a huge risk and market distortion. CCP all over that announcement.
I see/believe that IRA in the USA is going to cause overbuilding of battery capacity in short term. The reaction of CATL seems to be indicative. We are seeing various anode cathode plant announcements here in the USA and these may also distort the market. Big caveat here that China has been distortion inc for 20 years as the foreign investment flowed in and exports flowed out, exporting deflation. With the move to reshore, the huge drop in practical need for foreign exchange (crashing oil markets by 2030 will gut a lot of trade) , aging population, and constant conflict with partners in Europe and USA I think China may act aggressively to pump out evs. Direct and indirect subsidy could further distort battery markets.
nativewolf
Active Member
Also not sure they need to capture 20% to build 20 million cars by 2030 but they do need to build several more factories. Standing up and ramping seems to take a while. $25/kWh for batteries is interesting that puts real pressure on 4680 and all other battery efforts. great for stationary storage buyers.
Magnis press release: https://wcsecure.weblink.com.au/pdf/MNS/02633651.pdf
"Under the agreement Tesla will purchase a minimum of 17,500tpa starting from February 2025 with
a maximum of 35,000tpa for a minimum 3-year term at a fixed price.
The agreement is conditional on Magnis securing a final location for its commercial AAM facility by
30 June 2023, producing AAM from a pilot plant by 31 March 2024, commencing production from
the commercial AAM facility by 1 February 2025, and customer qualification."
petit_bateau
Active Member
As always looking around for better data took me to these two papers from the same underlying work, which I guess all here know about. If not, worth a read. Interesting to see that R&D effects are still dominant over Economies of Scale effects in price/cost reduction.
Re-examining rates of lithium-ion battery technology improvement and cost decline† Micah S. Ziegler a and Jessika E. Trancik *ab
Determinants of lithium-ion battery technology cost decline† Micah S. Ziegler, a Juhyun Song a and Jessika E. Trancik *ab
https://pubs.rsc.org/en/content/articlepdf/2021/ee/d1ee01313k?
... and can anyone point me in the direction of good data for the period 2018-2022 to extend the series ?
EDIT : Here is the Z&T data graphed along with the IEA data, using my volume data. Note that the 2027 and 2040 dates are excluding any forecast volumes for stationary storage. The vehicle volumes are per the S-curve data I've shown before, and assume the overall vehicle market steadies at 94m/year, etc etc.
Last edited:
nativewolf
Active Member

Does not seem that he has updated it, I will scratch atound
petit_bateau
Active Member
I've added in the BNEF data that is in 2022 $. It turns out that their 2022 volume is within a nats smidge of mine ") . Note they are expecting prices to hold flat for a few years. This means that the trend line from ther data is not directly comparable, and in any case it is at a significant variant from the more broadly-based Z&T composite series and associated dataset. Whether things return to trend in a few years remains to be seen.
. Note they are expecting prices to hold flat for a few years. This means that the trend line from ther data is not directly comparable, and in any case it is at a significant variant from the more broadly-based Z&T composite series and associated dataset. Whether things return to trend in a few years remains to be seen.
 about.bnef.com
For interest I also added in the ARK data from back in 2018 (i.e. contemporaneous to the Z&T data) which is 'actual' up to 2018 and projected thereafter. I find the step change in the price from 2012/2013 (associated with the Tesla S release) that ARK report as not being supported by the evidence from any other data. However the offset between the ARK trend line and the Z&T trend line may give some insight into the differential buying power at the time of Tesla vs the other purchasers. It seems likely that that difference has eroded as purchasers such as BYD and VAG now have comparable volumes to Tesla. Nonetheless it is worth observing that there is a difference between the average market price, and the best price from the cheapest supplier(s) to the most favoured customer(s).
(As an aside I find it depressing how poorly understood and misrepresented "Moore's Law" is. He was pointing out not that transistor density would double in n time; but rather that it must double in n time in order for a viable industry to exist. That is an important nuance to understand. The same nuance is not at play in Wright's Law or in Goddard's Law).
I'm guessing from the silence that no-one here can figure out a constraint on lithium supply side that has not previously already acted in the market, i.e. the answer to Q1 is "no foreseeable constraints to growth". That makes the next piece of my analysis somewhat more open. In the meantime, here is the outcome of this :

. Note they are expecting prices to hold flat for a few years. This means that the trend line from ther data is not directly comparable, and in any case it is at a significant variant from the more broadly-based Z&T composite series and associated dataset. Whether things return to trend in a few years remains to be seen.
Lithium-ion Battery Pack Prices Rise for First Time to an Average of $151/kWh | BloombergNEF
BloombergNEF’s annual battery price survey finds prices increased by 7% from 2021 to 2022 New York, December 6, 2022 – Rising raw material and
about.bnef.com
For interest I also added in the ARK data from back in 2018 (i.e. contemporaneous to the Z&T data) which is 'actual' up to 2018 and projected thereafter. I find the step change in the price from 2012/2013 (associated with the Tesla S release) that ARK report as not being supported by the evidence from any other data. However the offset between the ARK trend line and the Z&T trend line may give some insight into the differential buying power at the time of Tesla vs the other purchasers. It seems likely that that difference has eroded as purchasers such as BYD and VAG now have comparable volumes to Tesla. Nonetheless it is worth observing that there is a difference between the average market price, and the best price from the cheapest supplier(s) to the most favoured customer(s).
(As an aside I find it depressing how poorly understood and misrepresented "Moore's Law" is. He was pointing out not that transistor density would double in n time; but rather that it must double in n time in order for a viable industry to exist. That is an important nuance to understand. The same nuance is not at play in Wright's Law or in Goddard's Law).
I'm guessing from the silence that no-one here can figure out a constraint on lithium supply side that has not previously already acted in the market, i.e. the answer to Q1 is "no foreseeable constraints to growth". That makes the next piece of my analysis somewhat more open. In the meantime, here is the outcome of this :
Attachments

Knightshade
Well-Known Member
(As an aside I find it depressing how poorly understood and misrepresented "Moore's Law" is. He was pointing out not that transistor density would double in n time; but rather that it must double in n time in order for a viable industry to exist. That is an important nuance to understand. The same nuance is not at play in Wright's Law or in Goddard's Law).
Not sure you wanna cite Ark about anything to do with Wrights law
petit_bateau
Active Member
Indeed. I found their explanation of Moore's Law plain wrong, just like most. And I cannot see aspects of the data series they cite when I inspect other data series. But at least they are having a stab at it. Hey, and they get paid to do it as well !Not sure you wanna cite Ark about anything to do with Wrights law
MP with a nice 9.36% rise today, maybe people were catching up to their massive beat on Thursday.

 finance.yahoo.com
This quarterly report represents an earnings surprise of 200%. A quarter ago, it was expected that this company would post earnings of $0.30 per share when it actually produced earnings of $0.36, delivering a surprise of 20%.
Over the last four quarters, the company has surpassed consensus EPS estimates four times.
MP Materials Corp. (MP) Tops Q4 Earnings and Revenue Estimates
MP Materials Corp. (MP) delivered earnings and revenue surprises of 200% and 12.98%, respectively, for the quarter ended December 2022. Do the numbers hold clues to what lies ahead for the stock?
ABML with a 40% gain today on third party confirmation of lithium reserve
 finance.yahoo.com
One of the Largest Known Lithium Deposits in US Identified at American Battery Technology Company Tonopah Flats Property - Inferred Resource Estimated through S-K 1300 Compliant Study
American Battery Technology Company (ABTC) (OTCQX: ABML), an American critical battery materials company that is commercializing both its primary minerals manufacturing and secondary minerals lithium-ion battery recycling technologies, announced results of its third-party Qualified Person (QP)...
Similar threads
- Article
- Replies
- 64
- Views
- 7K
- Replies
- 16
- Views
- 1K
- Replies
- 27
- Views
- 3K