So that is the CR data on the Model S? I must be missing something. On a 1 to 5 scale the car averages 4.3, with solid 5's and 4's for major systems, but a 2 for one item "Body Integrity" and CR says the car is worse than average?What is "average"? I need to read the entire report, apparently.
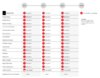
The average problem rates are listed in the chart (titled exactly that) at
Car Reliability History | Detailed Ratings - Consumer Reports, by model year.
There, they also say "Because problems with the engine major, cooling system, transmission major, and drive system can be serious and expensive to repair, our calculations give extra weight to problems in those areas."
From the table, for a '15, almost every system has an average problem rate of under 1% (not sure how much under 1%). 3 of them are 1% and audio system is 2%. So, if you could imagine that some '15 car had even a 1% problem rate on many systems and maybe even a few with 2% to boot, that would definitely make a car well below average.
- - - Updated - - -
I am not going to go all fanboi on CR, but the engineer in me does not quite understand the logic of the rating:
View attachment 98595
(source: Consumer Reports,
http://www.consumerreports.org/cro/tesla-model-s-reliability.htm)
...
On a side note, as much as folks keep calling out the drive system, it has trended up from "fair" to "excellent".
No, it hasn't. Compare the drive unit rating on the '13 and '14 at
Consumer Reports reliability of Model S - worse than average - Page 2 to the above. Very good turned into fair on the '13. Excellent turned into very good on '14.
But that's not really what's important. From what I understand about their survey and backed up by
Car Reliability History | Detailed Ratings - Consumer Reports
These charts are based on more than 740,000 responses to our 2015 Annual Auto Survey conducted by the Consumer Reports National Research Center. Consumer Reports subscribers reported on any serious problems they had with their vehicles during the past 12 months that they considered serious because of cost, failure, safety, or downtime, in any of the trouble spots included in the table below.
The scores in the charts are based on the percentage of respondents who reported problems in each of the 17 trouble spots. Because high-mileage cars tend to encounter more problems than low-mileage cars, problem rates are standardized to minimize differences due to mileage. The 2015 models were generally less than six months old at the time of the survey, with an average of about 3,000 miles.
So, they survey, is, "hey, in the past 12 months, what problems did you have?" They're going to include results of all the vehicles that not beyond the age they won't report or where there's insufficient data (under 100 responses for a model year of a vehicle). A guy with a 2012 will have a set of problems (or no problem) in his 1st 12 months and likely a different set of problems for each successive 12 month period.
When I had a Nissan 350Z, I recall certain systems that were known to have a problem trickling their way thru the rating year by year, making their way thru the system. I don't recall which system it was, but here's an example. Let's say power windows tend to fail at the 2 year mark (in fact both of mine did on my 04 and were replaced under warranty).
So, when 2003 models hit the 2 year mark, you'll see a black mark for body hardware for the 03, but the 04 will look ok for that same year. But, next year, 03 will probably look fine for body hardware but 04 will get hit by that, since they hit the 2 year mark. Then, you'd see it the same thing happen: 03 ok, 04 ok, 05 hit. If Nissan improved the part, you'd stop seeing this bubbling thru.
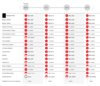
For perspective, here's a car w/an excellent reliability rating.


")