@Stats App , I couldn't figure out the reported phantom drain numbers reported in the Stats app so I exported them.
TL;DR - I think your "mi/hr" drain rates might be misleadingly high (at least, if people are using them to figure out how many miles they are using per day).
There are three columns in the exported data set:
Phantom Drain (mi) (My total number of miles is 123.2 mi over 48 days of using the app)
Drain Duration (for each gathered datapoint)
Drain Rate (presumably a calculated value based on the miles/duration)
Two issues:
Issue 1 (minor) :
If I multiply drain duration by drain rate and sum up it doesn't match the total drain. I think it's just due to rounding error (in my case it comes to 117 miles vs. 123 miles, over 48 days), but 5% is fairly large. I assume Phantom Drain in the first column are the "correct" values.
Issue 2 (less minor):
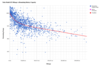
However, the Phantom Drain Rate you report in the app may not be correct. I think this value (in mi/hr) is high, because you're not counting all the hours - only the hours reported by the API.
For example, my total phantom drain over 48 days is: 123mi/48days = 2.56mi/day. That works out to ~0.1mi/hr. This is pretty close to my perception of what my phantom drain actually is.
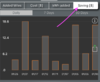
However, the Stats app reports my average to be 0.37mi/hr (which one might interpret to be 8.88mi/day) But my drain is definitely nowhere near that bad (based on the Stats app "Phantom Drain" column total). I was able to use my data to come up with close to the 0.37mi/hr number you report by taking the weighted average of the drain rates in the exported data set. However, note that the total reported number of
hours (Drain Duration) over 48 days was 331 hours (which is only 13.8 days). Hence, it's not correct to extrapolate the 0.37mi/hr number to 24hr/day*0.37mi/hr = 8.88mi/day. (And the hour discrepancy accounts for the issue with the reporting: day ratio = 48/13.8 ~ 3.48 , drain rate ratio = 8.88/2.56 ~ 3.46 )
Not sure what was intended here for this number. I'm not saying that it is wrong, I just can't use your reported mi/hr numbers to figure out what my actual phantom drain is per day (which I think would be a reasonable use of the number...).