Hi, new member and first post. I got my PW2 installed 5 days ago and came across Powerwall Companion and this club. I am super impressed (and in a bit of awe) at the app and what it can do. It is perfect for what I want to do. Two things:
- I had a problem with the battery stats page and getting data via my IP address. On the Gateway 2 I have a TPN, a TSN and a password (10 letter all uppercase). I have 2 IP addresses and tried both with the last 5 digits of the serial number (as instructed). I tried upper case, lower case, O instead of 0, the password (upper and lower). Nothing. Frustrated. On the off-chance I entered the last 5 digits of my password and
voilà  .
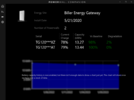
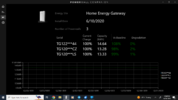
. I now have my serial number (TG123***), baseline and degradation. Something to update the instruction information?
- I get daily reports from my Fronius inverter. I use the data to estimate my future bill and to measure panel degradation (as well as performance against the supplier data). This tells me how much money I have saved vs not having the panels. I have now added to my spreadsheet the GW2 data to tell me my new future bill and how much money saved having the PW2 vs the panels vs nothing. My question (and I have not spent much time looking at this): what does the data export tell me? Is is watts/5 min interval? I add it up over a day and it does not seem to correlate with any other data. Is anybody using the data and what can you get from it? I want to automate my data rather than pencil and paper transcribing.
- A proxy for PW2 degradation (my 2 questions are (1,2,3), my 3 questions are...). Reading, it seems to me to not trust Tesla having the degradation data always available. I was thinking of using the usage data over night (from 100% to 30% supplying x kwhr) as a proxy for degradation%. Has anyone done that?
Sorry for the long post, really appreciate reading everyone's posts. It has been extremely helpful to me.
Glenn (Melbourne, Australia)


 .....
.....