I am at loss why real world fatality data released by NHTSA FARS recently is not supporting the claim that model y is a much safer car from fatal accident perspective. I would guess such gov data for 2021 is fairly accurate given the nature of such accidents.
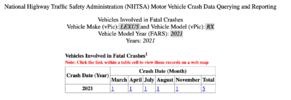
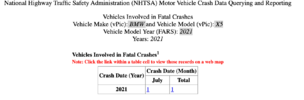
From real world gov data, model Y (about 160k units sold in 2021) is worse than bmw x5, mb gle, Lexus Rx on per car exposure basis. It is on par with suv like Toyota Highlander (slightly better) Honda pilot (about the same). Note all these suv are sort of best sellers behind model y regarding 2021 sales. Fatality here is # of cars involved in the fatal accidents during calendar year 2021, not necessarily people killed inside model y or other cars, but it is a good estimate of overall fatality of each accident. Model Y has no much sales before 2021. So this is the only year that comparison can be made. Given most of these suv has at least 50k sales for 2021, it's a good sample size.
With AP and FSD, how is that possible or we are saying model Y driver corhort is more careless (which I highly doubt). My point is if you are currently driving a mid size German lux suv, buying a Tesla model y is not making your ride safer from fatality perspective, based on this annual gov data.
You can take a look of the data yourself at below link (click on 2nd vehicle tab and enter make/model info)
Disclosure: I am neither long or short on Tesla stock. It is for my curiosity and purchase decision. I prefer independent verifiable results.
Last edited: