Welcome to Tesla Motors Club
Discuss Tesla's Model S, Model 3, Model X, Model Y, Cybertruck, Roadster and More.
Register

[Survey] Battery Degradation - All models from 2019

This site may earn commission on affiliate links.

eivissa

M3P 2022 82kWh - MYLR 2024 79kWh
Jun 11, 2020
605
1,465
Germany
This is an attempt of a deeper dive into the battery degradation of all the different battery packs.

In order to take part the preferred way is to fill out this Google form:


If you have already gathered these values and want to batch copy paste, then within this resulting table you will find the tab "import tool". Please take your time to select the right car. I might have to add some US only cars as the database so far mostly consists of European Tesla's.


Battery Degradation vs Odometer.png

Battery Degradation vs Time.png


Disclaimer:
  • This evaluation is only as good as the data that users worldwide feed into it.
  • There is no sponsoring, no Ref code promotion or anything of the like.
  • Some graphs will probably depict a worse picture than in reality as the initial degradation is the worst. Therefore younger batteries will have a worse trend line than older ones.
 

Update!​

  • We are past the 1000 row marker (1109).
  • Early Panasonic battery packs from the Model 3 LR/P 2018-2020 are showing very good results!
  • BYD Blade battery is showing highest range drop in any Tesla that I've seen so far.
  • Model S/X data Raven and Refresh 2021 is still very very limited. Hopefully some of you are able to contribute with their cars. Not many have been sold in Europe, but the Survey is meant for US cars (all Tesla's around the world really!) as well and you are able to select them in the survey.
Battery Degradation vs Time (5).png

chart (18).png
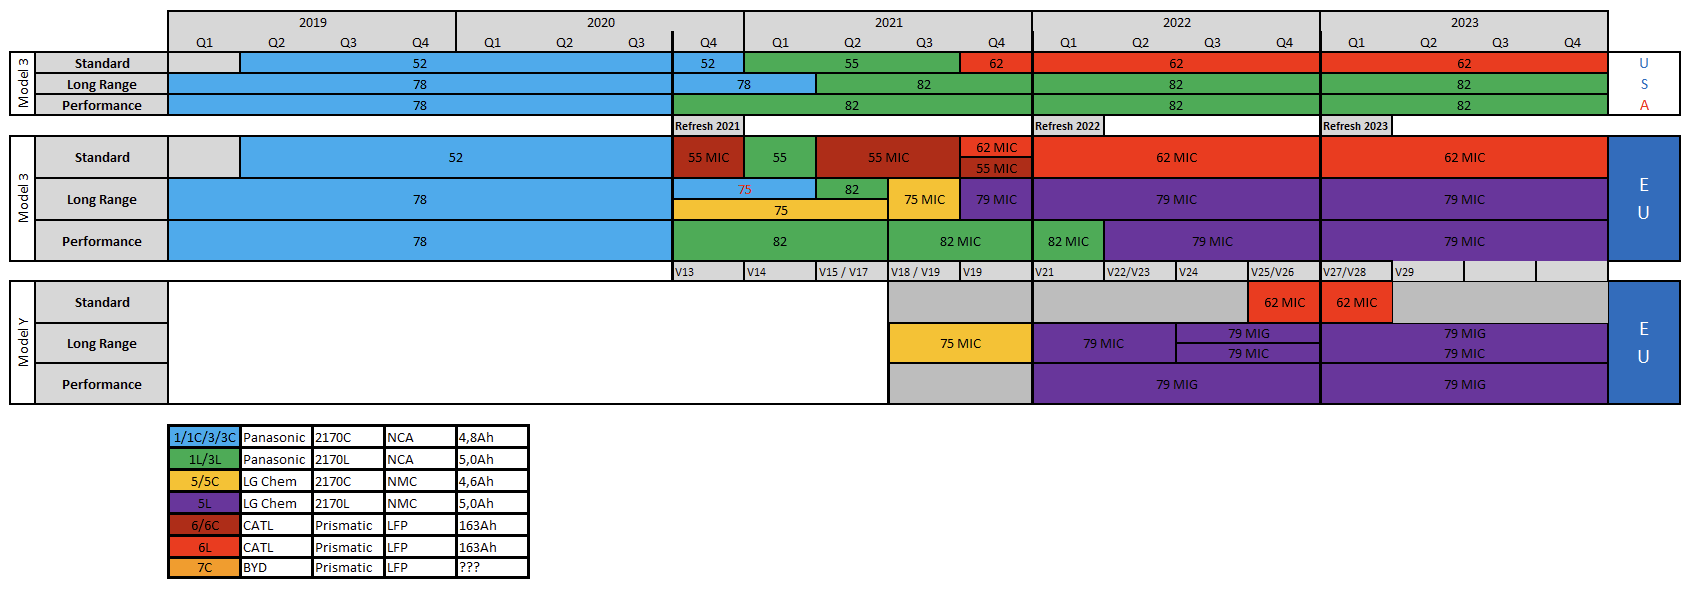
Car Version vs Degradation.png


Great contributions so far
:)
 
  • Like
Reactions: AAKEE
I looks like there is some need for more basic data for the table.
Palladium Plaid and LR Full Pack when new: 99.4 kWh Total capacity.

There is no possibility to make the energy calc, but I did write the nominal full pack numbers down instead.

I had 98.4kWh on several of the recorded 100% charges, but the calc still says 96 kWh wich is (perhaps) only the degradation threshold? (I found it to be more like 96.4-96.5 kWh when my car was increasing the NFP from the low "new value".
degradation.png
 
I looks like there is some need for more basic data for the table.
Palladium Plaid and LR Full Pack when new: 99.4 kWh Total capacity.

There is no possibility to make the energy calc, but I did write the nominal full pack numbers down instead.

I had 98.4kWh on several of the recorded 100% charges, but the calc still says 96 kWh wich is (perhaps) only the degradation threshold? (I found it to be more like 96.4-96.5 kWh when my car was increasing the NFP from the low "new value".
View attachment 1009221
There was a bug in the calculation. When I entered the software locked CATL 6L the Panasonic b1 dropped out of the database, so the data was missing for this pack. I fixed it now. 560km must be the degradation treshold, yes. No other explanation if this numbers stays the same for so much time, while the actual NFP is above it. We've seen this with all non-locked Panasonic's anyway.
 
  • Like
Reactions: AAKEE
There was a bug in the calculation. When I entered the software locked CATL 6L the Panasonic b1 dropped out of the database, so the data was missing for this pack. I fixed it now. 560km must be the degradation treshold, yes. No other explanation if this numbers stays the same for so much time, while the actual NFP is above it. We've seen this with all non-locked Panasonic's anyway.
Yes, maximum range shown with 21" is 560km.
Maximum range with 19" is 637km
 
  • Like
Reactions: eivissa
Given that you have the degradation values (dependent variable) and two independent variables of kn and time, you could complete a multivariate regression analysis, which would include all of the data on a single graph, and get a better understanding on how time and km's affect degradation. Happy to assist, if you are unfamiliar with how to complete this analysis.
 
  • Like
Reactions: johnny_cakes
Given that you have the degradation values (dependent variable) and two independent variables of kn and time, you could complete a multivariate regression analysis, which would include all of the data on a single graph, and get a better understanding on how time and km's affect degradation. Happy to assist, if you are unfamiliar with how to complete this analysis.
Just hook me up via PM and I am happy to make you an editor of the project. I can use all the help I can get :)
 
Sorry, but I only just seen your reply. I don't use this forum and only come across your degradation data via a random internet search. I have had a quick look and cant see how to send a PM. Are you able to provide some guidance on how I do this?
 
Sorry, but I only just seen your reply. I don't use this forum and only come across your degradation data via a random internet search. I have had a quick look and cant see how to send a PM. Are you able to provide some guidance on how I do this?
Top right corner, your icon then the letter.

If you like to send to eivissa, write tge three first letters (eiv) then you will get a proposal for the rihght recipient.
IMG_7237.jpeg
 
Sorry, but I only just seen your reply. I don't use this forum and only come across your degradation data via a random internet search. I have had a quick look and cant see how to send a PM. Are you able to provide some guidance on how I do this?
What @AAKEE said, but since you're a new member that feature may not be active until you've had a few more posts.
 
  • Like
Reactions: AAKEE