


Welcome to Tesla Motors Club
Discuss Tesla's Model S, Model 3, Model X, Model Y, Cybertruck, Roadster and More.
Register
Install the app
How to install the app on iOS
You can install our site as a web app on your iOS device by utilizing the Add to Home Screen feature in Safari. Please see this thread for more details on this.
Note: This feature may not be available in some browsers.
-
Want to remove ads? Register an account and login to see fewer ads, and become a Supporting Member to remove almost all ads.
You are using an out of date browser. It may not display this or other websites correctly.
You should upgrade or use an alternative browser.
You should upgrade or use an alternative browser.
Prediction: Coal has fallen. Nuclear is next then Oil.
- Thread starter nwdiver
- Start date
-
- Tags
- Energy Environment Policy

With no increased capability to export (aside from the growth in exports already in progress), I guess natural gas prices in the US will just have to go down. Therefore, Republicans and Faux News are not happy about this. LOL

Texas official blasts Biden admin for LNG export pause, warns millions of jobs at risk: 'war on energy'
A Texas official is urging the Biden administration to reconsider its pause on future applications to export pending future applications of liquified natural gas exports.
 www.foxbusiness.com
mspohr
Well-Known Member
Millions of jobs?With no increased capability to export (aside from the growth in exports already in progress), I guess natural gas prices in the US will just have to go down. Therefore, Republicans and Faux News are not happy about this. LOL
Texas official blasts Biden admin for LNG export pause, warns millions of jobs at risk: 'war on energy'
A Texas official is urging the Biden administration to reconsider its pause on future applications to export pending future applications of liquified natural gas exports.
Hyperbole.
mspohr
Well-Known Member
It is the end of an era for Big Oil in California, as the most populous U.S. state divorces itself from fossil fuels in its fight against climate change.
California's oil output a century ago amounted to it being the fourth-largest crude producer in the U.S., and spawned hundreds of oil drillers, including some of the largest still in existence. Oil led to its car culture of iconic highways, drive-in theaters, banks and restaurants that endures today.
On Friday, however, the marriage will officially end. The two largest U.S. oil producers, Exxon Mobil (XOM.N), opens new tab and Chevron (CVX.N), opens new tab, will formally disclose a combined $5 billion writedown of California assets when they report fourth-quarter results.

This off-grid island will switch from diesel to tidal energy [video]
The UK's Inyanga Marine Energy Group is going to build Southeast Asia's first tidal energy plant, which will power an off-grid island.
 electrek.co
More bad news for diesel.
mspohr
Well-Known Member
The US Added 1.2 Million EVs To The Grid Last Year, & Electricity Use Went Down - CleanTechnica
With over 1 million new EVs plugging into garage outlets, home charging stations, and Superchargers, you’d think our electricity usage would have shot up dramatically. You’d be wrong.
 cleantechnica.com
This is a great piece of news we should be talking about more. Electricity use has been flat for the last 20 years, hovering between 3,800 and 4,000 billion kWh annually even though the population has increased by 30 million people, our homes have gotten bigger, we’ve added over 5,000 data centers, and we now have 2.5 million EVs plugging into the grid.
How is this possible? One word — efficiency. Our electric appliances have gotten so much more efficient. Thank you technology improvements and appliance standards! There was a 50% improvement in US energy intensity (energy use compared to GDP) from 1980 to 2014, for example. (Also, in case you were curious, electricity use hasn’t stayed flat because people switched to gas. Residential gas use has been flat since the 1970s.)
iPlug
Active Member
No question on efficiency improvements, but we should add an "asterisk" to the developing EV situation.
Probably somewhat still in the noise at a national level. But it's a little early to say with current and near future EV impacts. California is ahead of the EV game and total electricity use has been increasing here the last 2 years of record, quite possibly due to that. Based on prior releases, we wont see 2023 data until this summer to see if the trend is sustained.
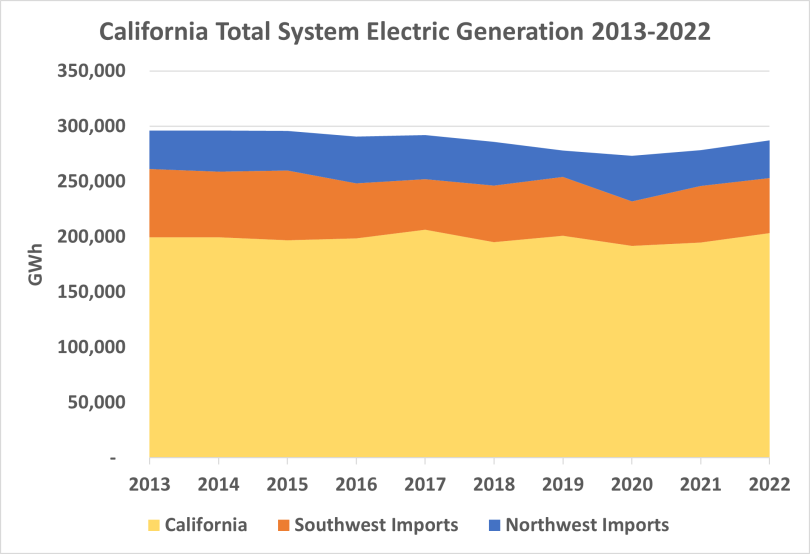
2022 Total System Electric Generation
Probably somewhat still in the noise at a national level. But it's a little early to say with current and near future EV impacts. California is ahead of the EV game and total electricity use has been increasing here the last 2 years of record, quite possibly due to that. Based on prior releases, we wont see 2023 data until this summer to see if the trend is sustained.
2022 Total System Electric Generation
I'm curious how much of that data excludes rooftop solar? After all, that electricity is behind the meter, so how would anyone tally it without installing a meter off of every solar panel (without double-counting when solar energy is curtailed)?
iPlug
Active Member
CA does not tally/estimate behind-the-meter rooftop solar in these hard numbers. They have given uncharted rough estimates in recent years in their yearly report discussion, but I do not recall off hand and much has changed in the last 2 years alone.
But based on this and knowing rooftop solar increases each year, the uptrend would be worse in CA.
But based on this and knowing rooftop solar increases each year, the uptrend would be worse in CA.
mspohr
Well-Known Member
Interesting that California electric generation is mostly flat and still below 10 years ago in spite of population growth.No question on efficiency improvements, but we should add an "asterisk" to the developing EV situation.
Probably somewhat still in the noise at a national level. But it's a little early to say with current and near future EV impacts. California is ahead of the EV game and total electricity use has been increasing here the last 2 years of record, quite possibly due to that. Based on prior releases, we wont see 2023 data until this summer to see if the trend is sustained.
2022 Total System Electric Generation
With all of the people whinging about "the grid can't handle EVs" you would think that electricity use would be growing rapidly but it looks like it's a minor factor which is offset by savings elsewhere.
CA does not tally/estimate behind-the-meter rooftop solar in these hard numbers. They have given uncharted rough estimates in recent years in their yearly report discussion, but I do not recall off hand and much has changed in the last 2 years alone.
But based on this and knowing rooftop solar increases each year, the uptrend would be worse in CA.
So therein lies the answer doesn't it? It's not so much that efficiency has offset our need for more energy, it's that more electricity production is hidden from the statistics. Many EV owners also have solar panels, masking the actual amount of electricity being used in the electrification of transport.
Interesting that California electric generation is mostly flat and still below 10 years ago in spite of population growth.
With all of the people whinging about "the grid can't handle EVs" you would think that electricity use would be growing rapidly but it looks like it's a minor factor which is offset by savings elsewhere.
See my reply to iPlug. I firmly believe that the grid can handle EV's, but I also believe the amount of electricity needed is being hidden, because of how much "self-consumption" is being done through rooftop solar.
mspohr
Well-Known Member
I tried to find out if/how CalISO measures behind the meter solar and couldn't find anything.See my reply to iPlug. I firmly believe that the grid can handle EV's, but I also believe the amount of electricity needed is being hidden, because of how much "self-consumption" is being done through rooftop solar.
Do you have any information beyond speculation?
I tried to find out if/how CalISO measures behind the meter solar and couldn't find anything.
Do you have any information beyond speculation?
You mean besides the fact that data doesn't magically appear without some sort of measuring device? The burden of proof rests on the other side I'm afraid.
CalISO can measure how much electricity is produced by the suppliers, or how much is drawn from the grid from the consumers, but self-consumption, just like moonshine wouldn't be traceable.
mspohr
Well-Known Member
I measure self consumption. Every web connected solar installation measures self consumption. It's not rocket science.You mean besides the fact that data doesn't magically appear without some sort of measuring device? The burden of proof rests on the other side I'm afraid.
CalISO can measure how much electricity is produced by the suppliers, or how much is drawn from the grid from the consumers, but self-consumption, just like moonshine wouldn't be traceable.
I measure self consumption. Every web connected solar installation measures self consumption. It's not rocket science.
You measure it, with whatever app you've installed, but how does it get reported to your utility or CalISO?
My Tesla App has a checkbox for sharing such data in order to participate in VPP, but my non-Tesla panels (and micro-inverter) don't have that same functionality.
iPlug
Active Member
From the link above:
This summary does not include behind-the-meter rooftop solar photovoltaic generation [1].
[1] Note, data reporting requirements for total system electric generation are limited to those facilities with a nameplate capacity of 1 MW and larger. As most solar PV systems installed on residential homes and commercial buildings are less than 1 MW, they are typically considered to be distributed generation (or located behind the utility meter) and are not required to report to the CEC.
2022 Total System Electric Generation
IIRC, they have not given an estimate of behind-the-meter solar PV in a few years.
iPlug
Active Member
Eureka, EIA to the rescue.
Form EIA-861M (formerly EIA-826) detailed data
Then open any of their excel files for “Small Scale PV estimate” by year
Timeframe: 2014 to present
Description: The data contain capacity (in AC) and estimated generation from PV solar systems less than 1 megawatt in size. The purpose of this threshold is to include PV capacity and generation that is otherwise not collected on Form EIA-860 and Form EIA-923, which collects data from utility-scale electricity -generation systems. Data are created from net-metering and non-net-metering distributed PV data using formulas and adjustments described in the technical notes of the Electric Power Monthly.
Historical Changes: Starting in December 2015, we began publishing generation and capacity estimates from small-scale solar installations. We backdated the data to include 2014 data. In 2017, we altered Form EIA-860 form to get more detailed data about net-metered generators, including type and amount of capacity net metered. Starting in 2020, we added Form EIA-861S respondents to the imputations.
For CA estimated behind-the-meter generation:
2023: 1.95 TWh
2022: 1.41 TWh
2021: 1.17 TWh
2020: 1.04 TWh
mspohr
Well-Known Member
Great, thanksEureka, EIA to the rescue.
Form EIA-861M (formerly EIA-826) detailed data
Then open any of their excel files for “Small Scale PV estimate” by year
Timeframe: 2014 to present
Description: The data contain capacity (in AC) and estimated generation from PV solar systems less than 1 megawatt in size. The purpose of this threshold is to include PV capacity and generation that is otherwise not collected on Form EIA-860 and Form EIA-923, which collects data from utility-scale electricity -generation systems. Data are created from net-metering and non-net-metering distributed PV data using formulas and adjustments described in the technical notes of the Electric Power Monthly.
Historical Changes: Starting in December 2015, we began publishing generation and capacity estimates from small-scale solar installations. We backdated the data to include 2014 data. In 2017, we altered Form EIA-860 form to get more detailed data about net-metered generators, including type and amount of capacity net metered. Starting in 2020, we added Form EIA-861S respondents to the imputations.
For CA estimated behind-the-meter generation:
2023: 1.95 TWh
2022: 1.41 TWh
2021: 1.17 TWh
2020: 1.04 TWh
So, behind the meter adds about 0.6% to the totals.
iPlug
Active Member
Regarding electric vehicles in California, our state Energy Commission reports EVs accounted for 1.9% of California’s total electricity consumption in 2022 and forecast it would be 10.4% in 2030 and 21.9% in 2035.
Race to zero: Can California’s power grid handle a 15-fold increase in electric cars?
Race to zero: Can California’s power grid handle a 15-fold increase in electric cars?
Similar threads
- Replies
- 13
- Views
- 2K
- Replies
- 1
- Views
- 2K
- Replies
- 77
- Views
- 11K
- Replies
- 32
- Views
- 7K